
 by
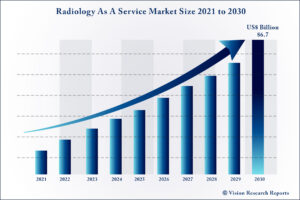
by The global Radiology As A Service market size is expected to be worth around US$ 6.7 billion by 2030, according to a new report by Vision Research Reports.
The global Radiology As A Service market size was valued at US$ 2.1 billion in 2020 and is anticipated to grow at a CAGR of 20.3% during forecast period 2021 to 2030.
Download Exclusive Sample of Report@ https://www.visionresearchreports.com/report/sample/38998
Table of Contents
Radiology As A Service Market Report Coverage
| Report Scope | Details |
| Market Size | US$ 6.7 billion by 2030 |
| Growth Rate | CAGR of 20.3% From 2021 to 2030 |
| Base Year | 2021 |
| Forecast Period | 2021 to 2030 |
| Segments Covered | Service, End user |
| Regional Scope | North America, Europe, Asia Pacific, Latin America, Middle East & Africa |
| Companies Mentioned | Philips Healthcare (Direct Radiology); GE Healthcare; Nanox.ARC; USARAD Holdings Inc.; Virtual Radiologic; Onrad Inc.; RamSoft Inc.; TeleDiagnostic Solutions; Teleradiology Solutions; National Diagnostic Imaging; Real Rads; Telemedicine Clinic U.K.; Vesta Teleradiology; DICOM Grid, Inc. (dba Ambra Health); Teleconsult Europe; Medica PLC |
Radiology As A Service Market Growth Factors
The increasing number of medical images and low availability of radiologists around the globe are the factors propelling the market growth over forecast years. According to the report published by the National Health Service (NHS) England, nearly 42.7 million medical images were reported in 2018 compared to 42.1 million in 2017, which indicates an increase of 1.4% yearly. The radiology as a service model provides quality diagnostic imaging services through teleradiology, technology management, cloud-based imaging, and consulting services via trained professionals. radiology as a service offers 24/7 service support to patients and radiologists across the globe. Increasing healthcare expenditure and the growing adoption of advanced cloud-based platforms are anticipated to accelerate the market growth over the forecast years.
By Service Analysis
The teleradiology service type segment dominated the market in 2020 with a revenue share of over 67%. An increase in the prevalence of several chronic diseases, such as cancer, tumor, and cardiac disorders, which, in turn, produced more diagnostic radiology images to drive the segment growth.
Increasing technological advancement, particularly the AI platform, provides additional insights into the teleradiology service. Service providers in the market are increasingly focusing on the introduction of advancement of technology to provide innovative teleradiology services.
Technology management services is among the fastest-growing segments and is expected to be a sizable segment over the forecast years. Growing demand for remote management of technology in the healthcare centers, particularly in the radiology departments, will drive the segment.
By End-user Analysis
The hospitals segment dominated the global market in 2020 with a revenue share of 53.0%. Primary preference of patients for the treatment and diagnosis using different imaging modalities in the hospitals is the key factor responsible for the high revenue share of this segment.
The diagnostic imaging center was the second-largest end-user segment in 2020 owing to the high adoption of teleradiology services for various imaging procedures. The availability of high pay scale radiologists in these centers coupled with high investment for the technological advancement of medical imaging equipment is anticipated to drive the segment further.
The nursing home end-user segment is estimated to register the fastest CAGR of 23.5% over the forecast periods. Patients’ transportation to the radiology centers for CT, MRI, and X-ray examinations may be an exhausting and disorienting experience.
By Regional Analysis
North America dominated the global market with a revenue share of over 50%. The highest consumer base for radiology procedures coupled with a growing number of teleradiology service providers is the factor anticipated to fuel the regional growth in the market over the forecast years.
Asia Pacific is estimated to grow at the fastest CAGR from 2021-2030. The growing per capita income and increasing internet users in Asian countries, such as China, India, and Singapore, are anticipated to drive the demand for radiology as a service in the region over the forecast years.
Europe accounted for the second-highest revenue share in 2020. The U.K. and Germany are the biggest consumers for teleradiology. The growing number of radiology procedures and the shortage of radiologists in this region are the major factors expected to drive the market over the forecast years.
Read also @ Buccal Drug Delivery Market to Reach US$ 8.9 Bn by 2030
Major Key Players Covered in The Radiology As A Service Market Report include
- Philips Healthcare (Direct Radiology)
- GE Healthcare
- Nanox.ARC
- USARAD Holdings Inc.
- Virtual Radiologic
- ONRAD Inc.
- RamSoft Inc.
- TeleDiagnostic Solutions
- Teleradiology Solutions
- National Diagnostic Imaging
- Real Rads
- Telemedicine Clinic U.K.
- Vesta Teleradiology
- DICOM Grid, Inc. (dba Ambra Health)
- Teleconsult Europe
- Medica Group PLC
Radiology As A Service Market Segmentation
- By Service
- Teleradiology
- Cloud-based Imaging IT Services
- Consulting Services
- Technology Management Services
- By End-user
- Hospitals
- Diagnostic Imaging Centers
- Radiology Clinics
- Physician Offices
- Nursing Homes
- Regional
- North America
- U.S.
- Canada
- Europe
- Germany
- U.K.
- France
- Italy
- Spain
- Russia
- Asia Pacific
- Japan
- China
- India
- Australia
- Singapore
- South Korea
- Latin America
- Brazil
- Mexico
- Argentina
- MEA
- South Africa
- Saudi Arabia
- UAE
- North America
Table of Contents
Chapter 1. Introduction
1.1. Research Objective
1.2. Scope of the Study
1.3. Definition
Chapter 2. Research Methodology
2.1. Research Approach
2.2. Data Sources
2.3. Assumptions & Limitations
Chapter 3. Executive Summary
3.1. Market Snapshot
Chapter 4. Market Variables and Scope
4.1. Introduction
4.2. Market Classification and Scope
4.3. Industry Value Chain Analysis
4.3.1. Raw Material Procurement Analysis
4.3.2. Sales and Distribution Channel Analysis
4.3.3. Downstream Buyer Analysis
Chapter 5. Market Dynamics Analysis and Trends
5.1. Market Dynamics
5.1.1. Market Drivers
5.1.2. Market Restraints
5.1.3. Market Opportunities
5.2. Porter’s Five Forces Analysis
5.2.1. Bargaining power of suppliers
5.2.2. Bargaining power of buyers
5.2.3. Threat of substitute
5.2.4. Threat of new entrants
5.2.5. Degree of competition
Chapter 6. Competitive Landscape
6.1.1. Company Market Share/Positioning Analysis
6.1.2. Key Strategies Adopted by Players
6.1.3. Vendor Landscape
6.1.3.1. List of Suppliers
6.1.3.2. List of Buyers
Chapter 7. Global Radiology As A Service Market, By Service
7.1. Radiology As A Service Market, by Service, 2021-2030
7.1.1. Teleradiology
7.1.1.1. Market Revenue and Forecast (2017-2030)
7.1.2. Cloud-based Imaging IT Services
7.1.2.1. Market Revenue and Forecast (2017-2030)
7.1.3. Consulting Services
7.1.3.1. Market Revenue and Forecast (2017-2030)
7.1.4. Technology Management Services
7.1.4.1. Market Revenue and Forecast (2017-2030)
Chapter 8. Global Radiology As A Service Market, By End-user
8.1. Radiology As A Service Market, by End-user, 2021-2030
8.1.1. Hospitals
8.1.1.1. Market Revenue and Forecast (2017-2030)
8.1.2. Diagnostic Imaging Centers
8.1.2.1. Market Revenue and Forecast (2017-2030)
8.1.3. Radiology Clinics
8.1.3.1. Market Revenue and Forecast (2017-2030)
8.1.4. Physician Offices
8.1.4.1. Market Revenue and Forecast (2017-2030)
8.1.5. Nursing Homes
8.1.5.1. Market Revenue and Forecast (2017-2030)
Chapter 9. Global Radiology As A Service Market, Regional Estimates and Trend Forecast
9.1. North America
9.1.1. Market Revenue and Forecast, by Service (2017-2030)
9.1.2. Market Revenue and Forecast, by End-user (2017-2030)
9.1.3. U.S.
9.1.3.1. Market Revenue and Forecast, by Service (2017-2030)
9.1.3.2. Market Revenue and Forecast, by End-user (2017-2030)
9.1.4. Rest of North America
9.1.4.1. Market Revenue and Forecast, by Service (2017-2030)
9.1.4.2. Market Revenue and Forecast, by End-user (2017-2030)
9.2. Europe
9.2.1. Market Revenue and Forecast, by Service (2017-2030)
9.2.2. Market Revenue and Forecast, by End-user (2017-2030)
9.2.3. UK
9.2.3.1. Market Revenue and Forecast, by Service (2017-2030)
9.2.3.2. Market Revenue and Forecast, by End-user (2017-2030)
9.2.4. Germany
9.2.4.1. Market Revenue and Forecast, by Service (2017-2030)
9.2.4.2. Market Revenue and Forecast, by End-user (2017-2030)
9.2.5. France
9.2.5.1. Market Revenue and Forecast, by Service (2017-2030)
9.2.5.2. Market Revenue and Forecast, by End-user (2017-2030)
9.2.6. Rest of Europe
9.2.6.1. Market Revenue and Forecast, by Service (2017-2030)
9.2.6.2. Market Revenue and Forecast, by End-user (2017-2030)
9.3. APAC
9.3.1. Market Revenue and Forecast, by Service (2017-2030)
9.3.2. Market Revenue and Forecast, by End-user (2017-2030)
9.3.3. India
9.3.3.1. Market Revenue and Forecast, by Service (2017-2030)
9.3.3.2. Market Revenue and Forecast, by End-user (2017-2030)
9.3.4. China
9.3.4.1. Market Revenue and Forecast, by Service (2017-2030)
9.3.4.2. Market Revenue and Forecast, by End-user (2017-2030)
9.3.5. Japan
9.3.5.1. Market Revenue and Forecast, by Service (2017-2030)
9.3.5.2. Market Revenue and Forecast, by End-user (2017-2030)
9.3.6. Rest of APAC
9.3.6.1. Market Revenue and Forecast, by Service (2017-2030)
9.3.6.2. Market Revenue and Forecast, by End-user (2017-2030)
9.4. MEA
9.4.1. Market Revenue and Forecast, by Service (2017-2030)
9.4.2. Market Revenue and Forecast, by End-user (2017-2030)
9.4.3. GCC
9.4.3.1. Market Revenue and Forecast, by Service (2017-2030)
9.4.3.2. Market Revenue and Forecast, by End-user (2017-2030)
9.4.4. North Africa
9.4.4.1. Market Revenue and Forecast, by Service (2017-2030)
9.4.4.2. Market Revenue and Forecast, by End-user (2017-2030)
9.4.5. South Africa
9.4.5.1. Market Revenue and Forecast, by Service (2017-2030)
9.4.5.2. Market Revenue and Forecast, by End-user (2017-2030)
9.4.6. Rest of MEA
9.4.6.1. Market Revenue and Forecast, by Service (2017-2030)
9.4.6.2. Market Revenue and Forecast, by End-user (2017-2030)
9.5. Latin America
9.5.1. Market Revenue and Forecast, by Service (2017-2030)
9.5.2. Market Revenue and Forecast, by End-user (2017-2030)
9.5.3. Brazil
9.5.3.1. Market Revenue and Forecast, by Service (2017-2030)
9.5.3.2. Market Revenue and Forecast, by End-user (2017-2030)
9.5.4. Rest of LATAM
9.5.4.1. Market Revenue and Forecast, by Service (2017-2030)
9.5.4.2. Market Revenue and Forecast, by End-user (2017-2030)
Chapter 10. Company Profiles
10.1. Philips Healthcare (Direct Radiology)
10.1.1. Company Overview
10.1.2. Service Offerings
10.1.3. Financial Performance
10.1.4. Recent Initiatives
10.2. GE Healthcare
10.2.1. Company Overview
10.2.2. Service Offerings
10.2.3. Financial Performance
10.2.4. Recent Initiatives
10.3. Nanox.ARC
10.3.1. Company Overview
10.3.2. Service Offerings
10.3.3. Financial Performance
10.3.4. Recent Initiatives
10.4. USARAD Holdings Inc.
10.4.1. Company Overview
10.4.2. Service Offerings
10.4.3. Financial Performance
10.4.4. Recent Initiatives
10.5. Virtual Radiologic
10.5.1. Company Overview
10.5.2. Service Offerings
10.5.3. Financial Performance
10.5.4. Recent Initiatives
10.6. ONRAD Inc.
10.6.1. Company Overview
10.6.2. Service Offerings
10.6.3. Financial Performance
10.6.4. Recent Initiatives
10.7. RamSoft Inc.
10.7.1. Company Overview
10.7.2. Service Offerings
10.7.3. Financial Performance
10.7.4. Recent Initiatives
10.8. TeleDiagnostic Solutions
10.8.1. Company Overview
10.8.2. Service Offerings
10.8.3. Financial Performance
10.8.4. Recent Initiatives
10.9. Teleradiology Solutions
10.9.1. Company Overview
10.9.2. Service Offerings
10.9.3. Financial Performance
10.9.4. Recent Initiatives
10.10. National Diagnostic Imaging
10.10.1. Company Overview
10.10.2. Service Offerings
10.10.3. Financial Performance
10.10.4. Recent Initiatives
Chapter 11. Research Methodology
11.1. Primary Research
11.2. Secondary Research
11.3. Assumptions
Chapter 12. Appendix
12.1. About Us
12.2. Glossary of Terms
Buy this Research Report study@ https://www.visionresearchreports.com/report/cart/38998
Contact Us:
Vision Research Reports
Call: +1 9197 992 333