
 by
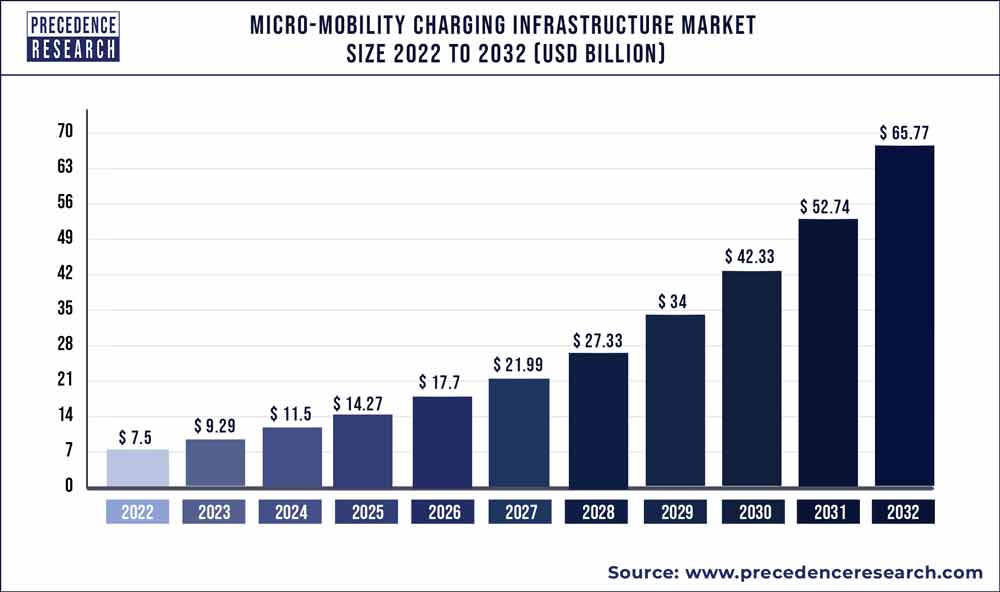
by Precedence Research a new report on micro-mobility charging infrastructure market size, share, growth, industry trends, and forecast 2030, covering various industry elements and growth trends helpful for predicting the market’s future. The global micro-mobility charging infrastructure market size was valued at US$ 6.23 billion in 2021. The global micro-mobility charging infrastructure market is projected to reach US$ 45 billion by 2030, registering a compound annual growth rate (CAGR) of 24.57% during the forecast period from 2022 to 2030.
Download Free Sample Copy with TOC@ https://www.precedenceresearch.com/sample/1707
The global micro-mobility charging infrastructure market report offers various segments analysis by size, trends, growth factors, opportunities and key country outlook to 2030. The report offers a detailed analysis and information as per micro-mobility charging infrastructure, market segments helping our readers to get a comprehensive overview of the global market. Several players are planning to focus on developing cost-effective products or services, aiming to maintain a strong foothold in the market.
Micro-mobility Charging Infrastructure Market Report Scope
| Report Coverage | Details |
| Market Size by 2030 | USD 45 Billion |
| Growth Rate from 2022 to 2030 | CAGR of 24.57% |
| Asia Pacific Market Share in 2021 | 45% |
| E-scooters Segment Market Share in 2021 | 61% |
| Base Year | 2021 |
| Forecast Period | 2022 to 2030 |
| Segments Covered | Vehicle Type, Power Source, Charger, End User, Geography |
The company profiling of leading market players is included this report with Porter’s five forces analysis and Value Chain analysis. Further, the strategies exercised by the companies for expansion of business through mergers, acquisitions, and other business development measures are discussed in the report. The financial parameters which are assessed include the sales, profits and the overall revenue generated by the key players of Market.
Read Also@ Hybrid Vehicle Market Size to Hit Around US$ 1670.5 bn by 2030
Some of the prominent players in the micro-mobility charging infrastructure market include:
- Robert Bosch, GmbH
- Bikeep
- Bike energy.
- Ather energy
- Flower turbines.
- Ground control systems.
- Perch mobility.
- Solum PV.
- Magment GmbH.
- The Mobility House GmbH.
- SWIFTMILE
Micro-mobility Charging Infrastructure Market Segmentation
By Vehicle type
- E- scooter
- E- bikes
- E-unicycles
- E-skateboards
By Charger
- Wired Charger
- Wireless Charger
By Power Source
- Battery Powered
- Solar Powered
By End User
- Residential
- Commercial
Regional Segmentation
- Asia-Pacific [China, Southeast Asia, India, Japan, Korea, Western Asia]
- Europe [Germany, UK, France, Italy, Russia, Spain, Netherlands, Turkey, Switzerland]
- North America [United States, Canada, Mexico]
- South America [Brazil, Argentina, Columbia, Chile, Peru]
- Middle East & Africa [GCC, North Africa, South Africa]
Key Questions are
- What are the key factors influencing the micro-mobility charging infrastructure market in each region?
- How much value will the global market generate by the end of the forecast period?
- What will be the CAGR of the global market between 2022 and 2030?
- What would be the Y-o-Y growth trend of the global market between 2022 and 2030?
- What is the future scope and current trends in technologies of the global market?
- What is the revenue of the global market based on segments?
- Which key strategies are used by top players of the global market?
- Which are the leading companies in the global market?
- What are the essential strategies by key stakeholders in the market to expand their geographic presence?
- What are the major advancements witnessed in the global market?
Research Objectives and Research Approach
The comprehensive report on the global micro-mobility charging infrastructure market begins with an overview, followed by the scope and objectives of the study. The report provides detailed explanation of the objectives behind this study and key vendors and distributors operating in the market and regulatory scenario for approval of products. Following this, the report provides detailed explanation of objectives of this study and laid down by accredited agencies in the purview of research in the global micro-mobility charging infrastructure market.
It is followed by market introduction, market dynamics, and an overview of the global market, which includes analysis of market drivers, restraints, and trends pertaining to the global market. Furthermore, Y-o-Y growth analysis with elaborated insights has been provided in order to understand the Y-o-Y growth trend of the global market.
For reading comprehensibility, the report has been compiled in a chapter-wise layout, with each section divided into smaller sections. The report comprises an exhaustive collection of graphs and tables that are appropriately interspersed. Pictorial representation of actual and projected values of key segments is visually appealing to readers. This also allows comparison of the market shares of key segments in the past and at the end of the forecast period.
The report analyzes the global micro-mobility charging infrastructure market in terms of type, application, region and others. Key segments under each criteria are studied at length, and the market share for each of these at the end of 2030 has also been provided. Such valuable insights enable market stakeholders in making informed business decisions for investment in the global market.
Why should you invest in this report?
If you are aiming to enter the global micro-mobility charging infrastructure market, this report is a comprehensive guide that provides crystal clear insights into this niche market. All the major application areas for micro-mobility charging infrastructure are covered in this report and information is given on the important regions of the world where this market is likely to boom during the forecast period of 2022-2030 so that you can plan your strategies to enter this market accordingly.
Besides, through this report, you can have a complete grasp of the level of competition you will be facing in this hugely competitive market and if you are an established player in this market already, this report will help you gauge the strategies that your competitors have adopted to stay as market leaders in this market. For new entrants to this market, the voluminous data provided in this report is invaluable.
Table of Contents
Chapter 1. Introduction
1.1. Research Objective
1.2. Scope of the Study
1.3. Definition
Chapter 2. Research Methodology
2.1. Research Approach
2.2. Data Sources
2.3. Assumptions & Limitations
Chapter 3. Executive Summary
3.1. Market Snapshot
Chapter 4. Market Variables and Scope
4.1. Introduction
4.2. Market Classification and Scope
4.3. Industry Value Chain Analysis
4.3.1. Raw Material Procurement Analysis
4.3.2. Sales and Distribution Channel Analysis
4.3.3. Downstream Buyer Analysis
Chapter 5. COVID 19 Impact on Micro-mobility Charging Infrastructure Market
5.1. COVID-19 Landscape: Micro-mobility Charging Infrastructure Industry Impact
5.2. COVID 19 – Impact Assessment for the Industry
5.3. COVID 19 Impact: Global Major Government Policy
5.4. Market Trends and Opportunities in the COVID-19 Landscape
Chapter 6. Market Dynamics Analysis and Trends
6.1. Market Dynamics
6.1.1. Market Drivers
6.1.2. Market Restraints
6.1.3. Market Opportunities
6.2. Porter’s Five Forces Analysis
6.2.1. Bargaining power of suppliers
6.2.2. Bargaining power of buyers
6.2.3. Threat of substitute
6.2.4. Threat of new entrants
6.2.5. Degree of competition
Chapter 7. Competitive Landscape
7.1.1. Company Market Share/Positioning Analysis
7.1.2. Key Strategies Adopted by Players
7.1.3. Vendor Landscape
7.1.3.1. List of Suppliers
7.1.3.2. List of Buyers
Chapter 8. Global Micro-mobility Charging Infrastructure Market, By Vehicle
8.1. Micro-mobility Charging Infrastructure Market, by Vehicle Type, 2022-2030
8.1.1. E-scooter
8.1.1.1. Market Revenue and Forecast (2017-2030)
8.1.2. E-bikes
8.1.2.1. Market Revenue and Forecast (2017-2030)
8.1.3. E-unicycles
8.1.3.1. Market Revenue and Forecast (2017-2030)
8.1.4. E-skateboards
8.1.4.1. Market Revenue and Forecast (2017-2030)
Chapter 9. Global Micro-mobility Charging Infrastructure Market, By Charger
9.1. Micro-mobility Charging Infrastructure Market, by Charger, 2022-2030
9.1.1. Wired Charger
9.1.1.1. Market Revenue and Forecast (2017-2030)
9.1.2. Wireless Charger
9.1.2.1. Market Revenue and Forecast (2017-2030)
Chapter 10. Global Micro-mobility Charging Infrastructure Market, By Power Source Type
10.1. Micro-mobility Charging Infrastructure Market, by Power Source Type, 2022-2030
10.1.1. Battery Powered
10.1.1.1. Market Revenue and Forecast (2017-2030)
10.1.2. Solar Powered
10.1.2.1. Market Revenue and Forecast (2017-2030)
Chapter 11. Global Micro-mobility Charging Infrastructure Market, By End User
11.1. Micro-mobility Charging Infrastructure Market, by End User, 2022-2030
11.1.1. Residential
11.1.1.1. Market Revenue and Forecast (2017-2030)
11.1.2. Commercial
11.1.2.1. Market Revenue and Forecast (2017-2030)
Chapter 12. Global Micro-mobility Charging Infrastructure Market, Regional Estimates and Trend Forecast
12.1. North America
12.1.1. Market Revenue and Forecast, by Vehicle (2017-2030)
12.1.2. Market Revenue and Forecast, by Charger (2017-2030)
12.1.3. Market Revenue and Forecast, by Power Source Type (2017-2030)
12.1.4. Market Revenue and Forecast, by End User (2017-2030)
12.1.5. U.S.
12.1.5.1. Market Revenue and Forecast, by Vehicle (2017-2030)
12.1.5.2. Market Revenue and Forecast, by Charger (2017-2030)
12.1.5.3. Market Revenue and Forecast, by Power Source Type (2017-2030)
12.1.5.4. Market Revenue and Forecast, by End User (2017-2030)
12.1.6. Rest of North America
12.1.6.1. Market Revenue and Forecast, by Vehicle (2017-2030)
12.1.6.2. Market Revenue and Forecast, by Charger (2017-2030)
12.1.6.3. Market Revenue and Forecast, by Power Source Type (2017-2030)
12.1.6.4. Market Revenue and Forecast, by End User (2017-2030)
12.2. Europe
12.2.1. Market Revenue and Forecast, by Vehicle (2017-2030)
12.2.2. Market Revenue and Forecast, by Charger (2017-2030)
12.2.3. Market Revenue and Forecast, by Power Source Type (2017-2030)
12.2.4. Market Revenue and Forecast, by End User (2017-2030)
12.2.5. UK
12.2.5.1. Market Revenue and Forecast, by Vehicle (2017-2030)
12.2.5.2. Market Revenue and Forecast, by Charger (2017-2030)
12.2.5.3. Market Revenue and Forecast, by Power Source Type (2017-2030)
12.2.5.4. Market Revenue and Forecast, by End User (2017-2030)
12.2.6. Germany
12.2.6.1. Market Revenue and Forecast, by Vehicle (2017-2030)
12.2.6.2. Market Revenue and Forecast, by Charger (2017-2030)
12.2.6.3. Market Revenue and Forecast, by Power Source Type (2017-2030)
12.2.6.4. Market Revenue and Forecast, by End User (2017-2030)
12.2.7. France
12.2.7.1. Market Revenue and Forecast, by Vehicle (2017-2030)
12.2.7.2. Market Revenue and Forecast, by Charger (2017-2030)
12.2.7.3. Market Revenue and Forecast, by Power Source Type (2017-2030)
12.2.7.4. Market Revenue and Forecast, by End User (2017-2030)
12.2.8. Rest of Europe
12.2.8.1. Market Revenue and Forecast, by Vehicle (2017-2030)
12.2.8.2. Market Revenue and Forecast, by Charger (2017-2030)
12.2.8.3. Market Revenue and Forecast, by Power Source Type (2017-2030)
12.2.8.4. Market Revenue and Forecast, by End User (2017-2030)
12.3. APAC
12.3.1. Market Revenue and Forecast, by Vehicle (2017-2030)
12.3.2. Market Revenue and Forecast, by Charger (2017-2030)
12.3.3. Market Revenue and Forecast, by Power Source Type (2017-2030)
12.3.4. Market Revenue and Forecast, by End User (2017-2030)
12.3.5. India
12.3.5.1. Market Revenue and Forecast, by Vehicle (2017-2030)
12.3.5.2. Market Revenue and Forecast, by Charger (2017-2030)
12.3.5.3. Market Revenue and Forecast, by Power Source Type (2017-2030)
12.3.5.4. Market Revenue and Forecast, by End User (2017-2030)
12.3.6. China
12.3.6.1. Market Revenue and Forecast, by Vehicle (2017-2030)
12.3.6.2. Market Revenue and Forecast, by Charger (2017-2030)
12.3.6.3. Market Revenue and Forecast, by Power Source Type (2017-2030)
12.3.6.4. Market Revenue and Forecast, by End User (2017-2030)
12.3.7. Japan
12.3.7.1. Market Revenue and Forecast, by Vehicle (2017-2030)
12.3.7.2. Market Revenue and Forecast, by Charger (2017-2030)
12.3.7.3. Market Revenue and Forecast, by Power Source Type (2017-2030)
12.3.7.4. Market Revenue and Forecast, by End User (2017-2030)
12.3.8. Rest of APAC
12.3.8.1. Market Revenue and Forecast, by Vehicle (2017-2030)
12.3.8.2. Market Revenue and Forecast, by Charger (2017-2030)
12.3.8.3. Market Revenue and Forecast, by Power Source Type (2017-2030)
12.3.8.4. Market Revenue and Forecast, by End User (2017-2030)
12.4. MEA
12.4.1. Market Revenue and Forecast, by Vehicle (2017-2030)
12.4.2. Market Revenue and Forecast, by Charger (2017-2030)
12.4.3. Market Revenue and Forecast, by Power Source Type (2017-2030)
12.4.4. Market Revenue and Forecast, by End User (2017-2030)
12.4.5. GCC
12.4.5.1. Market Revenue and Forecast, by Vehicle (2017-2030)
12.4.5.2. Market Revenue and Forecast, by Charger (2017-2030)
12.4.5.3. Market Revenue and Forecast, by Power Source Type (2017-2030)
12.4.5.4. Market Revenue and Forecast, by End User (2017-2030)
12.4.6. North Africa
12.4.6.1. Market Revenue and Forecast, by Vehicle (2017-2030)
12.4.6.2. Market Revenue and Forecast, by Charger (2017-2030)
12.4.6.3. Market Revenue and Forecast, by Power Source Type (2017-2030)
12.4.6.4. Market Revenue and Forecast, by End User (2017-2030)
12.4.7. South Africa
12.4.7.1. Market Revenue and Forecast, by Vehicle (2017-2030)
12.4.7.2. Market Revenue and Forecast, by Charger (2017-2030)
12.4.7.3. Market Revenue and Forecast, by Power Source Type (2017-2030)
12.4.7.4. Market Revenue and Forecast, by End User (2017-2030)
12.4.8. Rest of MEA
12.4.8.1. Market Revenue and Forecast, by Vehicle (2017-2030)
12.4.8.2. Market Revenue and Forecast, by Charger (2017-2030)
12.4.8.3. Market Revenue and Forecast, by Power Source Type (2017-2030)
12.4.8.4. Market Revenue and Forecast, by End User (2017-2030)
12.5. Latin America
12.5.1. Market Revenue and Forecast, by Vehicle (2017-2030)
12.5.2. Market Revenue and Forecast, by Charger (2017-2030)
12.5.3. Market Revenue and Forecast, by Power Source Type (2017-2030)
12.5.4. Market Revenue and Forecast, by End User (2017-2030)
12.5.5. Brazil
12.5.5.1. Market Revenue and Forecast, by Vehicle (2017-2030)
12.5.5.2. Market Revenue and Forecast, by Charger (2017-2030)
12.5.5.3. Market Revenue and Forecast, by Power Source Type (2017-2030)
12.5.5.4. Market Revenue and Forecast, by End User (2017-2030)
12.5.6. Rest of LATAM
12.5.6.1. Market Revenue and Forecast, by Vehicle (2017-2030)
12.5.6.2. Market Revenue and Forecast, by Charger (2017-2030)
12.5.6.3. Market Revenue and Forecast, by Power Source Type (2017-2030)
12.5.6.4. Market Revenue and Forecast, by End User (2017-2030)
Chapter 13. Company Profiles
13.1. Robert Bosch, GmbH
13.1.1. Company Overview
13.1.2. Product Offerings
13.1.3. Financial Performance
13.1.4. Recent Initiatives
13.2. Bikeep
13.2.1. Company Overview
13.2.2. Product Offerings
13.2.3. Financial Performance
13.2.4. Recent Initiatives
13.3. Bike energy
13.3.1. Company Overview
13.3.2. Product Offerings
13.3.3. Financial Performance
13.3.4. Recent Initiatives
13.4. Ather energy
13.4.1. Company Overview
13.4.2. Product Offerings
13.4.3. Financial Performance
13.4.4. Recent Initiatives
13.5. Flower turbines
13.5.1. Company Overview
13.5.2. Product Offerings
13.5.3. Financial Performance
13.5.4. Recent Initiatives
13.6. Ground control systems
13.6.1. Company Overview
13.6.2. Product Offerings
13.6.3. Financial Performance
13.6.4. Recent Initiatives
13.7. Perch mobility
13.7.1. Company Overview
13.7.2. Product Offerings
13.7.3. Financial Performance
13.7.4. Recent Initiatives
13.8. Solum PV.
13.8.1. Company Overview
13.8.2. Product Offerings
13.8.3. Financial Performance
13.8.4. Recent Initiatives
13.9. Magment GmbH.
13.9.1. Company Overview
13.9.2. Product Offerings
13.9.3. Financial Performance
13.9.4. Recent Initiatives
13.10. The Mobility House GmbH.
13.10.1. Company Overview
13.10.2. Product Offerings
13.10.3. Financial Performance
13.10.4. Recent Initiatives
13.11. SWIFTMILE
13.11.1. Company Overview
13.11.2. Product Offerings
13.11.3. Financial Performance
13.11.4. Recent Initiatives
Chapter 14. Research Methodology
14.1. Primary Research
14.2. Secondary Research
14.3. Assumptions
Chapter 15. Appendix
15.1. About Us
15.2. Glossary of Terms
Buy This Premium Research Report Click Here@ https://www.precedenceresearch.com/checkout/1707
Our Press Release@ https://www.precedenceresearch.com/press-releases
About Us
Precedence Research is a Canada/India based company and one of the leading providers of strategic market insights. We offer executive-level blueprints of markets and solutions beyond flagship surveys. Our repository covers consultation, syndicated market studies, and customized research reports. Through our services we aim at connecting an organization’s goal with lucrative prospects globally.
From gauging investment feasibility to uncovering hidden growth opportunities, our market studies cover in-depth analysis, which also is interspersed with relevant statistics. Recommendation are often enclosed within our reports with the sole intent of enabling organizations achieve mission-critical success.
Contact Us:
Precedence Research
Apt 1408 1785 Riverside Drive Ottawa, ON, K1G 3T7, Canada
Call: +1 9197 992 333
Email: sales@precedenceresearch.com
Website: https://www.precedenceresearch.com