
 by
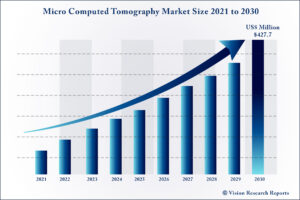
by The global micro computed tomography market size is expected to be worth around US$ 427.7 million by 2030, according to a new report by Vision Research Reports.
The global micro computed tomography market size was valued at US$ 160.3 million in 2020 and is anticipated to grow at a CAGR of 9.9% during forecast period 2021 to 2030.
Download Exclusive Sample of Report@ https://www.visionresearchreports.com/report/sample/38807
Table of Contents
Micro Computed Tomography Market Growth Factors
A growing number of applications and a significant demand for technologically advanced three-dimensional imaging technologies are driving the market for micro computed tomography (CT). In addition, the increasing use of micro-CT in research is expected to boost the market growth.
Micro-CT can be used to examine the internal structure of both material and biological materials without cutting them and preserving the samples or specimens for future research. Micro-CT scanning’s unique properties enable scientists to examine a sample’s morphology Micro-CT is used to research bone, teeth, tissue/organs, animal anatomy, plants, food, composite materials, medical devices, batteries, and other areas. Both in vivo and ex vivo scanning modes are available with these scanners.
Micro Computed Tomography Market Report Coverage
| Report Scope | Details |
| Market Size | US$ 427.7 million by 2030 |
| Growth Rate | CAGR of 9.9% From 2021 to 2030 |
| Base Year | 2021 |
| Forecast Period | 2021 to 2030 |
| Segments Covered | Product, application |
| Regional Scope | North America, Europe, Asia Pacific, Latin America, Middle East & Africa |
| Companies Mentioned | Bruker Corporation; PerkinElmer; Thermo Fisher Scientific; Zeiss, NeoScan; Sanying Precision Instruments Co.Ltd; North Star Imaging Inc; SCANCO Medical AG, TESCAN |
By Product Analysis
The ex-vivo micro-CT segment dominated the market and accounted for the largest revenue share of 77.9% in 2020, and is also expected to continue its dominance over the forecast period. Ex vivo micro-CT scanners provide improved spatial resolution, longer scan times (since dose to the sample isn’t of concern), higher signal-to-noise ratios, and hence superior images.
In-vivo CT scanners help in scanning longer objects, which are utilized in studies examining the impact of nutrition, drugs, body mass, and treatments on hormones, cancers, bone quality, bone growth, and numerous regeneration models.
By Application Analysis
the life sciences segment dominated the market for micro-CT and accounted for the largest revenue share of 23.8%. Owing to the high-resolution structural imaging and nanomechanical measurements provided by the micro-CT, which provide valuable insights to study various life sciences applications, which include animal anatomy, soft tissues, oncology, structural biology, neurosciences, cardiovascular studies, and so on.
The dentistry segment is anticipated to register the fastest growth rate over the forthcoming years. Since micro-CT has a wide range of applications in dentistry, from dental research to treatment. Micro-CT produces high-quality images of the tooth and its surrounding structures from the outer to the innermost structure.
By Regional Analysis
North America dominated the micro computed tomography market and accounted for the largest revenue share of 32.6% in 2020. The region is expected to exhibit a considerable growth rate over the forecast period. The existence of a large number of market competitors in the region, as well as the high frequency of new product releases, both seem to be factors contributing to regional market growth.
In Asia Pacific, the market is estimated to witness the fastest rate during the forecast period owing to the increased demand for better imaging devices and the rising frequency of research activities.
Read also @ Clinical Workflow Solutions Market to Reach US$ 25.6 Bn by 2030
Major Key Players Covered in The Micro Computed Tomography Market Report include
- Bruker Corporation
- PerkinElmer
- Thermo Fisher Scientific
- Zeiss
- NeoScan
- Sanying Precision Instruments Co.Ltd
- North Star Imaging Inc
- SCANCO Medical AG
- TESCAN
Micro Computed Tomography Market Segmentation
- By Product
- In-vivo
- Ex-vivo
- By Application
- Life Sciences
- Bones
- Dentistry
- Plants and Food
- Material Science
- Geology/Oil and Gas Geology
- Regional
- North America
- U.S.
- Canada
- Europe
- U.K.
- Germany
- France
- Italy
- Spain
- Norway
- Sweden `
- Russia
- Asia Pacific
- China
- Japan
- India
- Australia
- Thailand
- South Korea
- Latin America
- Brazil
- Mexico
- Argentina
- Middle East and Africa
- Saudi Arabia
- South Africa
- Turkey
- UAE
- North America
Table of Contents
Chapter 1. Introduction
1.1. Research Objective
1.2. Scope of the Study
1.3. Definition
Chapter 2. Research Methodology
2.1. Research Approach
2.2. Data Sources
2.3. Assumptions & Limitations
Chapter 3. Executive Summary
3.1. Market Snapshot
Chapter 4. Micro Computed Tomography Market Variables and Scope
4.1. Introduction
4.2. Market Classification and Scope
4.3. Industry Value Chain Analysis
4.3.1. Raw Material Procurement Analysis
4.3.2. Sales and Distribution Channel Analysis
4.3.3. Downstream Buyer Analysis
Chapter 5. Micro Computed Tomography Market Dynamics Analysis and Trends
5.1. Market Dynamics
5.1.1. Market Drivers
5.1.2. Market Restraints
5.1.3. Market Opportunities
5.2. Porter’s Five Forces Analysis
5.2.1. Bargaining power of suppliers
5.2.2. Bargaining power of buyers
5.2.3. Threat of substitute
5.2.4. Threat of new entrants
5.2.5. Degree of competition
Chapter 6. Competitive Landscape
6.1.1. Company Market Share/Positioning Analysis
6.1.2. Key Strategies Adopted by Players
6.1.3. Vendor Landscape
6.1.3.1. List of Suppliers
6.1.3.2. List of Buyers
Chapter 7. Global Micro Computed Tomography Market, By Product
7.1. Micro Computed Tomography Market, by Product, 2021-2030
7.1.1. In-vivo
7.1.1.1. Market Revenue and Forecast (2017-2030)
7.1.2. Ex-vivo
7.1.2.1. Market Revenue and Forecast (2017-2030)
Chapter 8. Global Micro Computed Tomography Market, By Application
8.1. Micro Computed Tomography Market, by Application, 2021-2030
8.1.1. Life Sciences
8.1.1.1. Market Revenue and Forecast (2017-2030)
8.1.2. Bones
8.1.2.1. Market Revenue and Forecast (2017-2030)
8.1.3. Dentistry
8.1.3.1. Market Revenue and Forecast (2017-2030)
8.1.4. Plants and Food
8.1.4.1. Market Revenue and Forecast (2017-2030)
8.1.5. Material Science
8.1.5.1. Market Revenue and Forecast (2017-2030)
8.1.6. Geology/Oil and Gas Geology
8.1.6.1. Market Revenue and Forecast (2017-2030)
Chapter 9. Global Micro Computed Tomography Market, Regional Estimates and Trend Forecast
9.1. North America
9.1.1. Market Revenue and Forecast, by Product (2017-2030)
9.1.2. Market Revenue and Forecast, by Application (2017-2030)
9.1.3. U.S.
9.1.3.1. Market Revenue and Forecast, by Product (2017-2030)
9.1.3.2. Market Revenue and Forecast, by Application (2017-2030)
9.1.4. Rest of North America
9.1.4.1. Market Revenue and Forecast, by Product (2017-2030)
9.1.4.2. Market Revenue and Forecast, by Application (2017-2030)
9.2. Europe
9.2.1. Market Revenue and Forecast, by Product (2017-2030)
9.2.2. Market Revenue and Forecast, by Application (2017-2030)
9.2.3. UK
9.2.3.1. Market Revenue and Forecast, by Product (2017-2030)
9.2.3.2. Market Revenue and Forecast, by Application (2017-2030)
9.2.4. Germany
9.2.4.1. Market Revenue and Forecast, by Product (2017-2030)
9.2.4.2. Market Revenue and Forecast, by Application (2017-2030)
9.2.5. France
9.2.5.1. Market Revenue and Forecast, by Product (2017-2030)
9.2.5.2. Market Revenue and Forecast, by Application (2017-2030)
9.2.6. Rest of Europe
9.2.6.1. Market Revenue and Forecast, by Product (2017-2030)
9.2.6.2. Market Revenue and Forecast, by Application (2017-2030)
9.3. APAC
9.3.1. Market Revenue and Forecast, by Product (2017-2030)
9.3.2. Market Revenue and Forecast, by Application (2017-2030)
9.3.3. India
9.3.3.1. Market Revenue and Forecast, by Product (2017-2030)
9.3.3.2. Market Revenue and Forecast, by Application (2017-2030)
9.3.4. China
9.3.4.1. Market Revenue and Forecast, by Product (2017-2030)
9.3.4.2. Market Revenue and Forecast, by Application (2017-2030)
9.3.5. Japan
9.3.5.1. Market Revenue and Forecast, by Product (2017-2030)
9.3.5.2. Market Revenue and Forecast, by Application (2017-2030)
9.3.6. Rest of APAC
9.3.6.1. Market Revenue and Forecast, by Product (2017-2030)
9.3.6.2. Market Revenue and Forecast, by Application (2017-2030)
9.4. MEA
9.4.1. Market Revenue and Forecast, by Product (2017-2030)
9.4.2. Market Revenue and Forecast, by Application (2017-2030)
9.4.3. GCC
9.4.3.1. Market Revenue and Forecast, by Product (2017-2030)
9.4.3.2. Market Revenue and Forecast, by Application (2017-2030)
9.4.4. North Africa
9.4.4.1. Market Revenue and Forecast, by Product (2017-2030)
9.4.4.2. Market Revenue and Forecast, by Application (2017-2030)
9.4.5. South Africa
9.4.5.1. Market Revenue and Forecast, by Product (2017-2030)
9.4.5.2. Market Revenue and Forecast, by Application (2017-2030)
9.4.6. Rest of MEA
9.4.6.1. Market Revenue and Forecast, by Product (2017-2030)
9.4.6.2. Market Revenue and Forecast, by Application (2017-2030)
9.5. Latin America
9.5.1. Market Revenue and Forecast, by Product (2017-2030)
9.5.2. Market Revenue and Forecast, by Application (2017-2030)
9.5.3. Brazil
9.5.3.1. Market Revenue and Forecast, by Product (2017-2030)
9.5.3.2. Market Revenue and Forecast, by Application (2017-2030)
9.5.4. Rest of LATAM
9.5.4.1. Market Revenue and Forecast, by Product (2017-2030)
9.5.4.2. Market Revenue and Forecast, by Application (2017-2030)
Chapter 10. Company Profiles
10.1. Bruker Corporation
10.1.1. Company Overview
10.1.2. Product Offerings
10.1.3. Financial Performance
10.1.4. Recent Initiatives
10.2. PerkinElmer
10.2.1. Company Overview
10.2.2. Product Offerings
10.2.3. Financial Performance
10.2.4. Recent Initiatives
10.3. Thermo Fisher Scientific
10.3.1. Company Overview
10.3.2. Product Offerings
10.3.3. Financial Performance
10.3.4. Recent Initiatives
10.4. Zeiss
10.4.1. Company Overview
10.4.2. Product Offerings
10.4.3. Financial Performance
10.4.4. Recent Initiatives
10.5. NeoScan
10.5.1. Company Overview
10.5.2. Product Offerings
10.5.3. Financial Performance
10.5.4. Recent Initiatives
10.6. Sanying Precision Instruments Co.Ltd
10.6.1. Company Overview
10.6.2. Product Offerings
10.6.3. Financial Performance
10.6.4. Recent Initiatives
10.7. North Star Imaging Inc
10.7.1. Company Overview
10.7.2. Product Offerings
10.7.3. Financial Performance
10.7.4. Recent Initiatives
10.8. SCANCO Medical AG
10.8.1. Company Overview
10.8.2. Product Offerings
10.8.3. Financial Performance
10.8.4. Recent Initiatives
10.9. TESCAN
10.9.1. Company Overview
10.9.2. Product Offerings
10.9.3. Financial Performance
10.9.4. Recent Initiatives
Chapter 11. Research Methodology
11.1. Primary Research
11.2. Secondary Research
11.3. Assumptions
Chapter 12. Appendix
12.1. About Us
12.2. Glossary of Terms
Buy this Research Report study@ https://www.visionresearchreports.com/report/cart/38807
Contact Us:
Vision Research Reports
Call: +1 9197 992 333