
 by
by The global Blood Transfusion Diagnostics market size is expected to be worth around US$ 10.8 billion by 2030, according to a new report by Vision Research Reports.
The global Blood Transfusion Diagnostics market size was valued at US$ 4,713.7 million in 2020 and is anticipated to grow at a CAGR of 7.6% during forecast period 2021 to 2030.
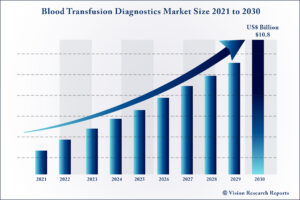
Table of Contents
Blood Transfusion Diagnostics Market Growth Factors
This growth can be attributed to the increasing rate of approval by the U.S. FDA for blood transfusion diagnostics products. The introduction of new technologies to assist in blood donation and storage is expected to further drive the market.
Growing initiatives for blood donation campaigns is another driver boosting market growth significantly. The slogan for the.2021 was Give blood and keep the world-beating. The major focus of this year’s campaign by WHO was to encourage the young population to donate and ensure a safe blood supply. With economies are relaxing their norms and the number of blood donation campaigns across the world is increasing, the need for blood transfusion diagnostics is expected to increase to the pre-COVID-19 level.
Blood Transfusion Diagnostics Market Report Coverage
| Report Scope | Details |
| Market Size | US$ 10.8 Billion by 2030 |
| Growth Rate | CAGR of 7.6% From 2021 to 2030 |
| Base Year | 2021 |
| Forecast Period | 2021 to 2030 |
| Segments Covered | Product, Application, End-use |
| Regional Scope | North America, Europe, Asia Pacific, Latin America, Middle East & Africa |
| Companies Mentioned | Immucor, Inc.; Ortho Clinical Diagnostics; Abbott; Bio-Rad Laboratories; F. Hoffmann-La Roche AG; Quotient Limited; BAG Healthcare GmbH; DiaSorin S.P.A.; Danaher;BIO KIT (Werfen) |
By Product Analysis
The reagents and kits segment dominated the market for blood transfusion diagnostics and accounted for the largest revenue share of 65.8%. Easy availability of products and repetitive purchase of these products required to screen both donor and recipient samples have majorly driven the segment growth.
Increasing the launch of products and approvals for different systems or automated systems by key players for blood transfusion is expected to boost the market growth.
By Application Analysis
The disease screening segment dominated the market for blood transfusion diagnostics and accounted for the largest revenue share of 60.0% in 2020. increasing safety screening of donated blood, to maintain safe transfusion; rising technological advancements; and wide product portfolios offered by key players in the market.
The blood grouping segment is expected to hold a significant revenue share during the study period. These diagnostic tests are commonly performed in the blood banks. Routine blood typing and cross-matching tests performed before transfusion therapy for identifying the compatibility of donor and recipient blood are some of the factors driving the segmental growth.
By End-use Analysis
The blood banks segment dominated the market for blood transfusion diagnostics and accounted for the largest revenue share of 40.9% in 2020. This is due to a large number of disease screening and blood typing services performed before transfusion therapy.
It is mandatory for hospitals to screen donated blood for infections, perform compatibility tests of donor and recipient as a pretransfusion therapy, and set parameters of hematology components. Thus, the hospitals’ segment accounted for significant shares in 2020.
By Regional Analysis
North America dominated the blood transfusion diagnostics market and accounted for the largest revenue share of 40.1% in 2020. The segment is expected to maintain its position during the forecast period. Increasing health awareness, high disposable income.
In Asia Pacific, the market for blood transfusion diagnostics is expected to grow at the fastest rate during the forecast period. the declining number of donors in Singapore and South Korea has led to less adoption of transfusion diagnostic tools in Asia Pacific.
Read also @ Anatomic Pathology Market: Opportunities And challenges by 2030
Major Key Players Covered in The Blood Transfusion Diagnostics Market Report include
- Immucor, Inc.
- Ortho Clinical Diagnostics
- Abbott
- Bio-Rad Laboratories
- F. Hoffmann-La Roche AG
- Quotient Limited
- BAG Healthcare GmbH
- DiaSorin S.P.A.
- Danaher
- BIOKIT (Werfen)
Blood Transfusion Diagnostics Market Segmentation
- By Product
- Reagents & Kits
- Instruments
- Others
- By Application
- Blood Grouping
- Disease Screening
- Serological Disease Screening
- Molecular Disease Screening
- By End-use
- Hospitals
- Blood Banks
- Diagnostic Laboratories
- Others
- Regional
- North America
- U.S.
- Canada
- Europe
- Germany
- U.K.
- Spain
- France
- Italy
- Russia
- Asia Pacific
- Japan
- China
- India
- South Korea
- Singapore
- Australia
- Latin America
- Brazil
- Mexico
- Argentina
- MEA
- South Africa
- Saudi Arabia
- UAE
- North America
Table of Contents
Chapter 1. Introduction
1.1. Research Objective
1.2. Scope of the Study
1.3. Definition
Chapter 2. Research Methodology
2.1. Research Approach
2.2. Data Sources
2.3. Assumptions & Limitations
Chapter 3. Executive Summary
3.1. Market Snapshot
Chapter 4. Blood Transfusion Diagnostics Market Variables and Scope
4.1. Introduction
4.2. Blood Transfusion Diagnostics Market Classification and Scope
4.3. Industry Value Chain Analysis
4.3.1. Raw Material Procurement Analysis
4.3.2. Sales and Distribution Channel Analysis
4.3.3. Downstream Buyer Analysis
Chapter 5. Blood Transfusion Diagnostics Market Dynamics Analysis and Trends
5.1. Market Dynamics
5.1.1. Market Drivers
5.1.2. Market Restraints
5.1.3. Market Opportunities
5.2. Porter’s Five Forces Analysis
5.2.1. Bargaining power of suppliers
5.2.2. Bargaining power of buyers
5.2.3. Threat of substitute
5.2.4. Threat of new entrants
5.2.5. Degree of competition
Chapter 6. Competitive Landscape
6.1.1. Company Market Share/Positioning Analysis
6.1.2. Key Strategies Adopted by Players
6.1.3. Vendor Landscape
6.1.3.1. List of Suppliers
6.1.3.2. List of Buyers
Chapter 7. Global Blood Transfusion Diagnostics Market, By Product
7.1. Blood Transfusion Diagnostics Market, by Product, 2021-2030
7.1.1. Reagents & Kits
7.1.1.1. Market Revenue and Forecast (2017-2030)
7.1.2. Instruments
7.1.2.1. Market Revenue and Forecast (2017-2030)
7.1.3. Others
7.1.3.1. Market Revenue and Forecast (2017-2030)
Chapter 8. Global Blood Transfusion Diagnostics Market, By Application
8.1. Blood Transfusion Diagnostics Market, by Application, 2021-2030
8.1.1. Blood Grouping
8.1.1.1. Market Revenue and Forecast (2017-2030)
8.1.2. Disease Screening
8.1.2.1. Market Revenue and Forecast (2017-2030)
Chapter 9. Global Blood Transfusion Diagnostics Market, By End User
9.1. Blood Transfusion Diagnostics Market, by End User, 2021-2030
9.1.1. Hospitals
9.1.1.1. Market Revenue and Forecast (2017-2030)
9.1.2. Blood Banks
9.1.2.1. Market Revenue and Forecast (2017-2030)
9.1.3. Diagnostic Laboratories
9.1.3.1. Market Revenue and Forecast (2017-2030)
9.1.4. Others
9.1.4.1. Market Revenue and Forecast (2017-2030)
Chapter 10. Global Blood Transfusion Diagnostics Market, Regional Estimates and Trend Forecast
10.1. North America
10.1.1. Market Revenue and Forecast, by Product (2017-2030)
10.1.2. Market Revenue and Forecast, by Application (2017-2030)
10.1.3. Market Revenue and Forecast, by End User (2017-2030)
10.1.4. U.S.
10.1.4.1. Market Revenue and Forecast, by Product (2017-2030)
10.1.4.2. Market Revenue and Forecast, by Application (2017-2030)
10.1.4.3. Market Revenue and Forecast, by End User (2017-2030)
10.1.5. Rest of North America
10.1.5.1. Market Revenue and Forecast, by Product (2017-2030)
10.1.5.2. Market Revenue and Forecast, by Application (2017-2030)
10.1.5.3. Market Revenue and Forecast, by End User (2017-2030)
10.2. Europe
10.2.1. Market Revenue and Forecast, by Product (2017-2030)
10.2.2. Market Revenue and Forecast, by Application (2017-2030)
10.2.3. Market Revenue and Forecast, by End User (2017-2030)
10.2.4. UK
10.2.4.1. Market Revenue and Forecast, by Product (2017-2030)
10.2.4.2. Market Revenue and Forecast, by Application (2017-2030)
10.2.4.3. Market Revenue and Forecast, by End User (2017-2030)
10.2.5. Germany
10.2.5.1. Market Revenue and Forecast, by Product (2017-2030)
10.2.5.2. Market Revenue and Forecast, by Application (2017-2030)
10.2.5.3. Market Revenue and Forecast, by End User (2017-2030)
10.2.6. France
10.2.6.1. Market Revenue and Forecast, by Product (2017-2030)
10.2.6.2. Market Revenue and Forecast, by Application (2017-2030)
10.2.6.3. Market Revenue and Forecast, by End User (2017-2030)
10.2.7. Rest of Europe
10.2.7.1. Market Revenue and Forecast, by Product (2017-2030)
10.2.7.2. Market Revenue and Forecast, by Application (2017-2030)
10.2.7.3. Market Revenue and Forecast, by End User (2017-2030)
10.3. APAC
10.3.1. Market Revenue and Forecast, by Product (2017-2030)
10.3.2. Market Revenue and Forecast, by Application (2017-2030)
10.3.3. Market Revenue and Forecast, by End User (2017-2030)
10.3.4. India
10.3.4.1. Market Revenue and Forecast, by Product (2017-2030)
10.3.4.2. Market Revenue and Forecast, by Application (2017-2030)
10.3.4.3. Market Revenue and Forecast, by End User (2017-2030)
10.3.5. China
10.3.5.1. Market Revenue and Forecast, by Product (2017-2030)
10.3.5.2. Market Revenue and Forecast, by Application (2017-2030)
10.3.5.3. Market Revenue and Forecast, by End User (2017-2030)
10.3.6. Japan
10.3.6.1. Market Revenue and Forecast, by Product (2017-2030)
10.3.6.2. Market Revenue and Forecast, by Application (2017-2030)
10.3.6.3. Market Revenue and Forecast, by End User (2017-2030)
10.3.7. Rest of APAC
10.3.7.1. Market Revenue and Forecast, by Product (2017-2030)
10.3.7.2. Market Revenue and Forecast, by Application (2017-2030)
10.3.7.3. Market Revenue and Forecast, by End User (2017-2030)
10.4. MEA
10.4.1. Market Revenue and Forecast, by Product (2017-2030)
10.4.2. Market Revenue and Forecast, by Application (2017-2030)
10.4.3. Market Revenue and Forecast, by End User (2017-2030)
10.4.4. GCC
10.4.4.1. Market Revenue and Forecast, by Product (2017-2030)
10.4.4.2. Market Revenue and Forecast, by Application (2017-2030)
10.4.4.3. Market Revenue and Forecast, by End User (2017-2030)
10.4.5. North Africa
10.4.5.1. Market Revenue and Forecast, by Product (2017-2030)
10.4.5.2. Market Revenue and Forecast, by Application (2017-2030)
10.4.5.3. Market Revenue and Forecast, by End User (2017-2030)
10.4.6. South Africa
10.4.6.1. Market Revenue and Forecast, by Product (2017-2030)
10.4.6.2. Market Revenue and Forecast, by Application (2017-2030)
10.4.6.3. Market Revenue and Forecast, by End User (2017-2030)
10.4.7. Rest of MEA
10.4.7.1. Market Revenue and Forecast, by Product (2017-2030)
10.4.7.2. Market Revenue and Forecast, by Application (2017-2030)
10.4.7.3. Market Revenue and Forecast, by End User (2017-2030)
10.5. Latin America
10.5.1. Market Revenue and Forecast, by Product (2017-2030)
10.5.2. Market Revenue and Forecast, by Application (2017-2030)
10.5.3. Market Revenue and Forecast, by End User (2017-2030)
10.5.4. Brazil
10.5.4.1. Market Revenue and Forecast, by Product (2017-2030)
10.5.4.2. Market Revenue and Forecast, by Application (2017-2030)
10.5.4.3. Market Revenue and Forecast, by End User (2017-2030)
10.5.5. Rest of LATAM
10.5.5.1. Market Revenue and Forecast, by Product (2017-2030)
10.5.5.2. Market Revenue and Forecast, by Application (2017-2030)
10.5.5.3. Market Revenue and Forecast, by End User (2017-2030)
Chapter 11. Company Profiles
11.1. Immucor, Inc.
11.1.1. Company Overview
11.1.2. Product Offerings
11.1.3. Financial Performance
11.1.4. Recent Initiatives
11.2. Ortho Clinical Diagnostics
11.2.1. Company Overview
11.2.2. Product Offerings
11.2.3. Financial Performance
11.2.4. Recent Initiatives
11.3. Abbott
11.3.1. Company Overview
11.3.2. Product Offerings
11.3.3. Financial Performance
11.3.4. Recent Initiatives
11.4. Air France KLM Group
11.4.1. Company Overview
11.4.2. Product Offerings
11.4.3. Financial Performance
11.4.4. Recent Initiatives
11.5. Bio-Rad Laboratories
11.5.1. Company Overview
11.5.2. Product Offerings
11.5.3. Financial Performance
11.5.4. Recent Initiatives
11.6. F. Hoffmann-La Roche AG
11.6.1. Company Overview
11.6.2. Product Offerings
11.6.3. Financial Performance
11.6.4. Recent Initiatives
11.7. Quotient Limited
11.7.1. Company Overview
11.7.2. Product Offerings
11.7.3. Financial Performance
11.7.4. Recent Initiatives
11.8. BAG Healthcare GmbH
11.8.1. Company Overview
11.8.2. Product Offerings
11.8.3. Financial Performance
11.8.4. Recent Initiatives
11.9. DiaSorin S.P.A.
11.9.1. Company Overview
11.9.2. Product Offerings
11.9.3. Financial Performance
11.9.4. Recent Initiatives
11.10. Danaher
11.10.1. Company Overview
11.10.2. Product Offerings
11.10.3. Financial Performance
11.10.4. Recent Initiatives
Chapter 12. Research Methodology
12.1. Primary Research
12.2. Secondary Research
12.3. Assumptions
Chapter 13. Appendix
13.1. About Us
13.2. Glossary of Terms
Buy this Research Report study@ https://www.visionresearchreports.com/report/cart/38912
Contact Us:
Vision Research Reports
Call: +1 9197 992 333